Diffraction
Aim: To determine the wavelength of Laser using one dimensional diffraction grating.
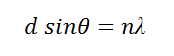
Apparatus used in the experiment: Laser, one dimensional diffraction grating, ruler, screen.
Apparatus to be used by you: 15cm or 30cm ruler.
Figure:
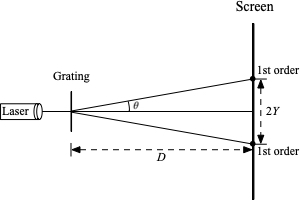
Formula:
where,
d = grating element,
n = order of maxima,
θ = angle between central maxima and first order maxima ,
λ = wavelength of laser
Procedure:
- Setup for the experiment is as given below.
- Laser is focused on the screen and grating is placed between the laser source and screen.
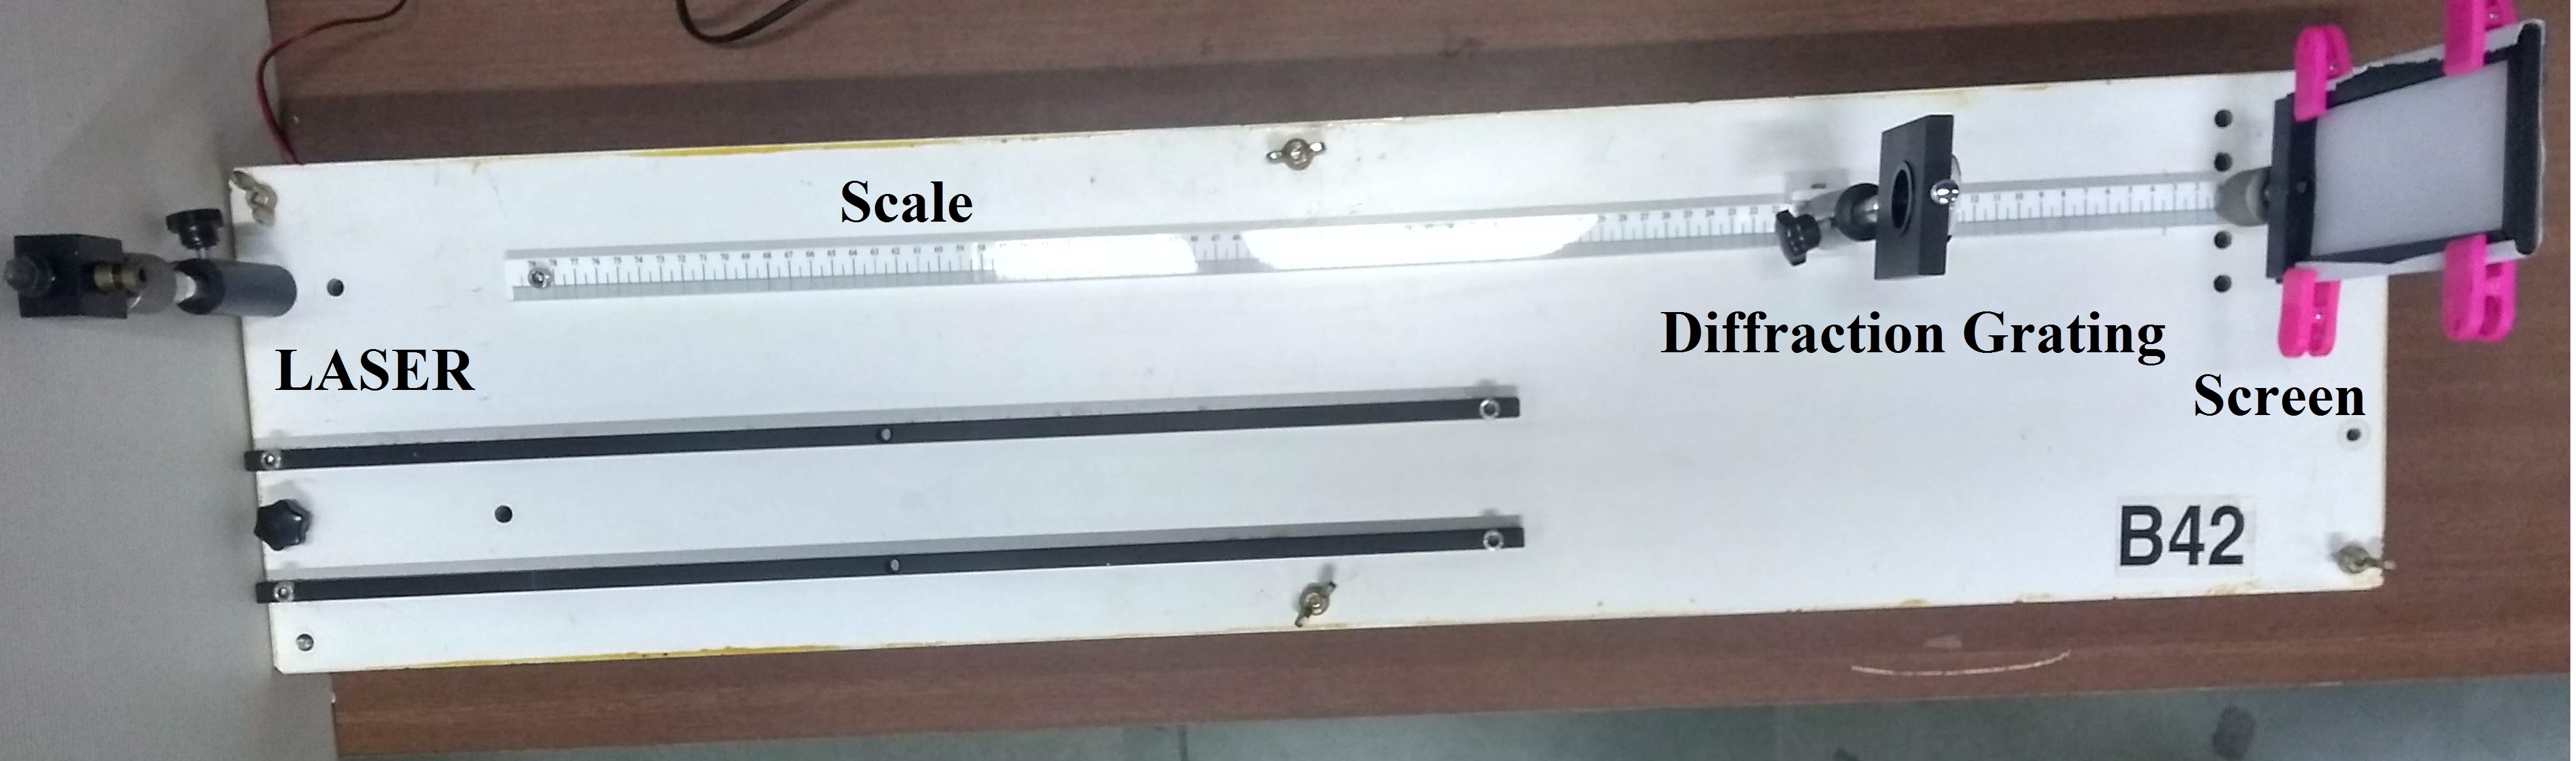
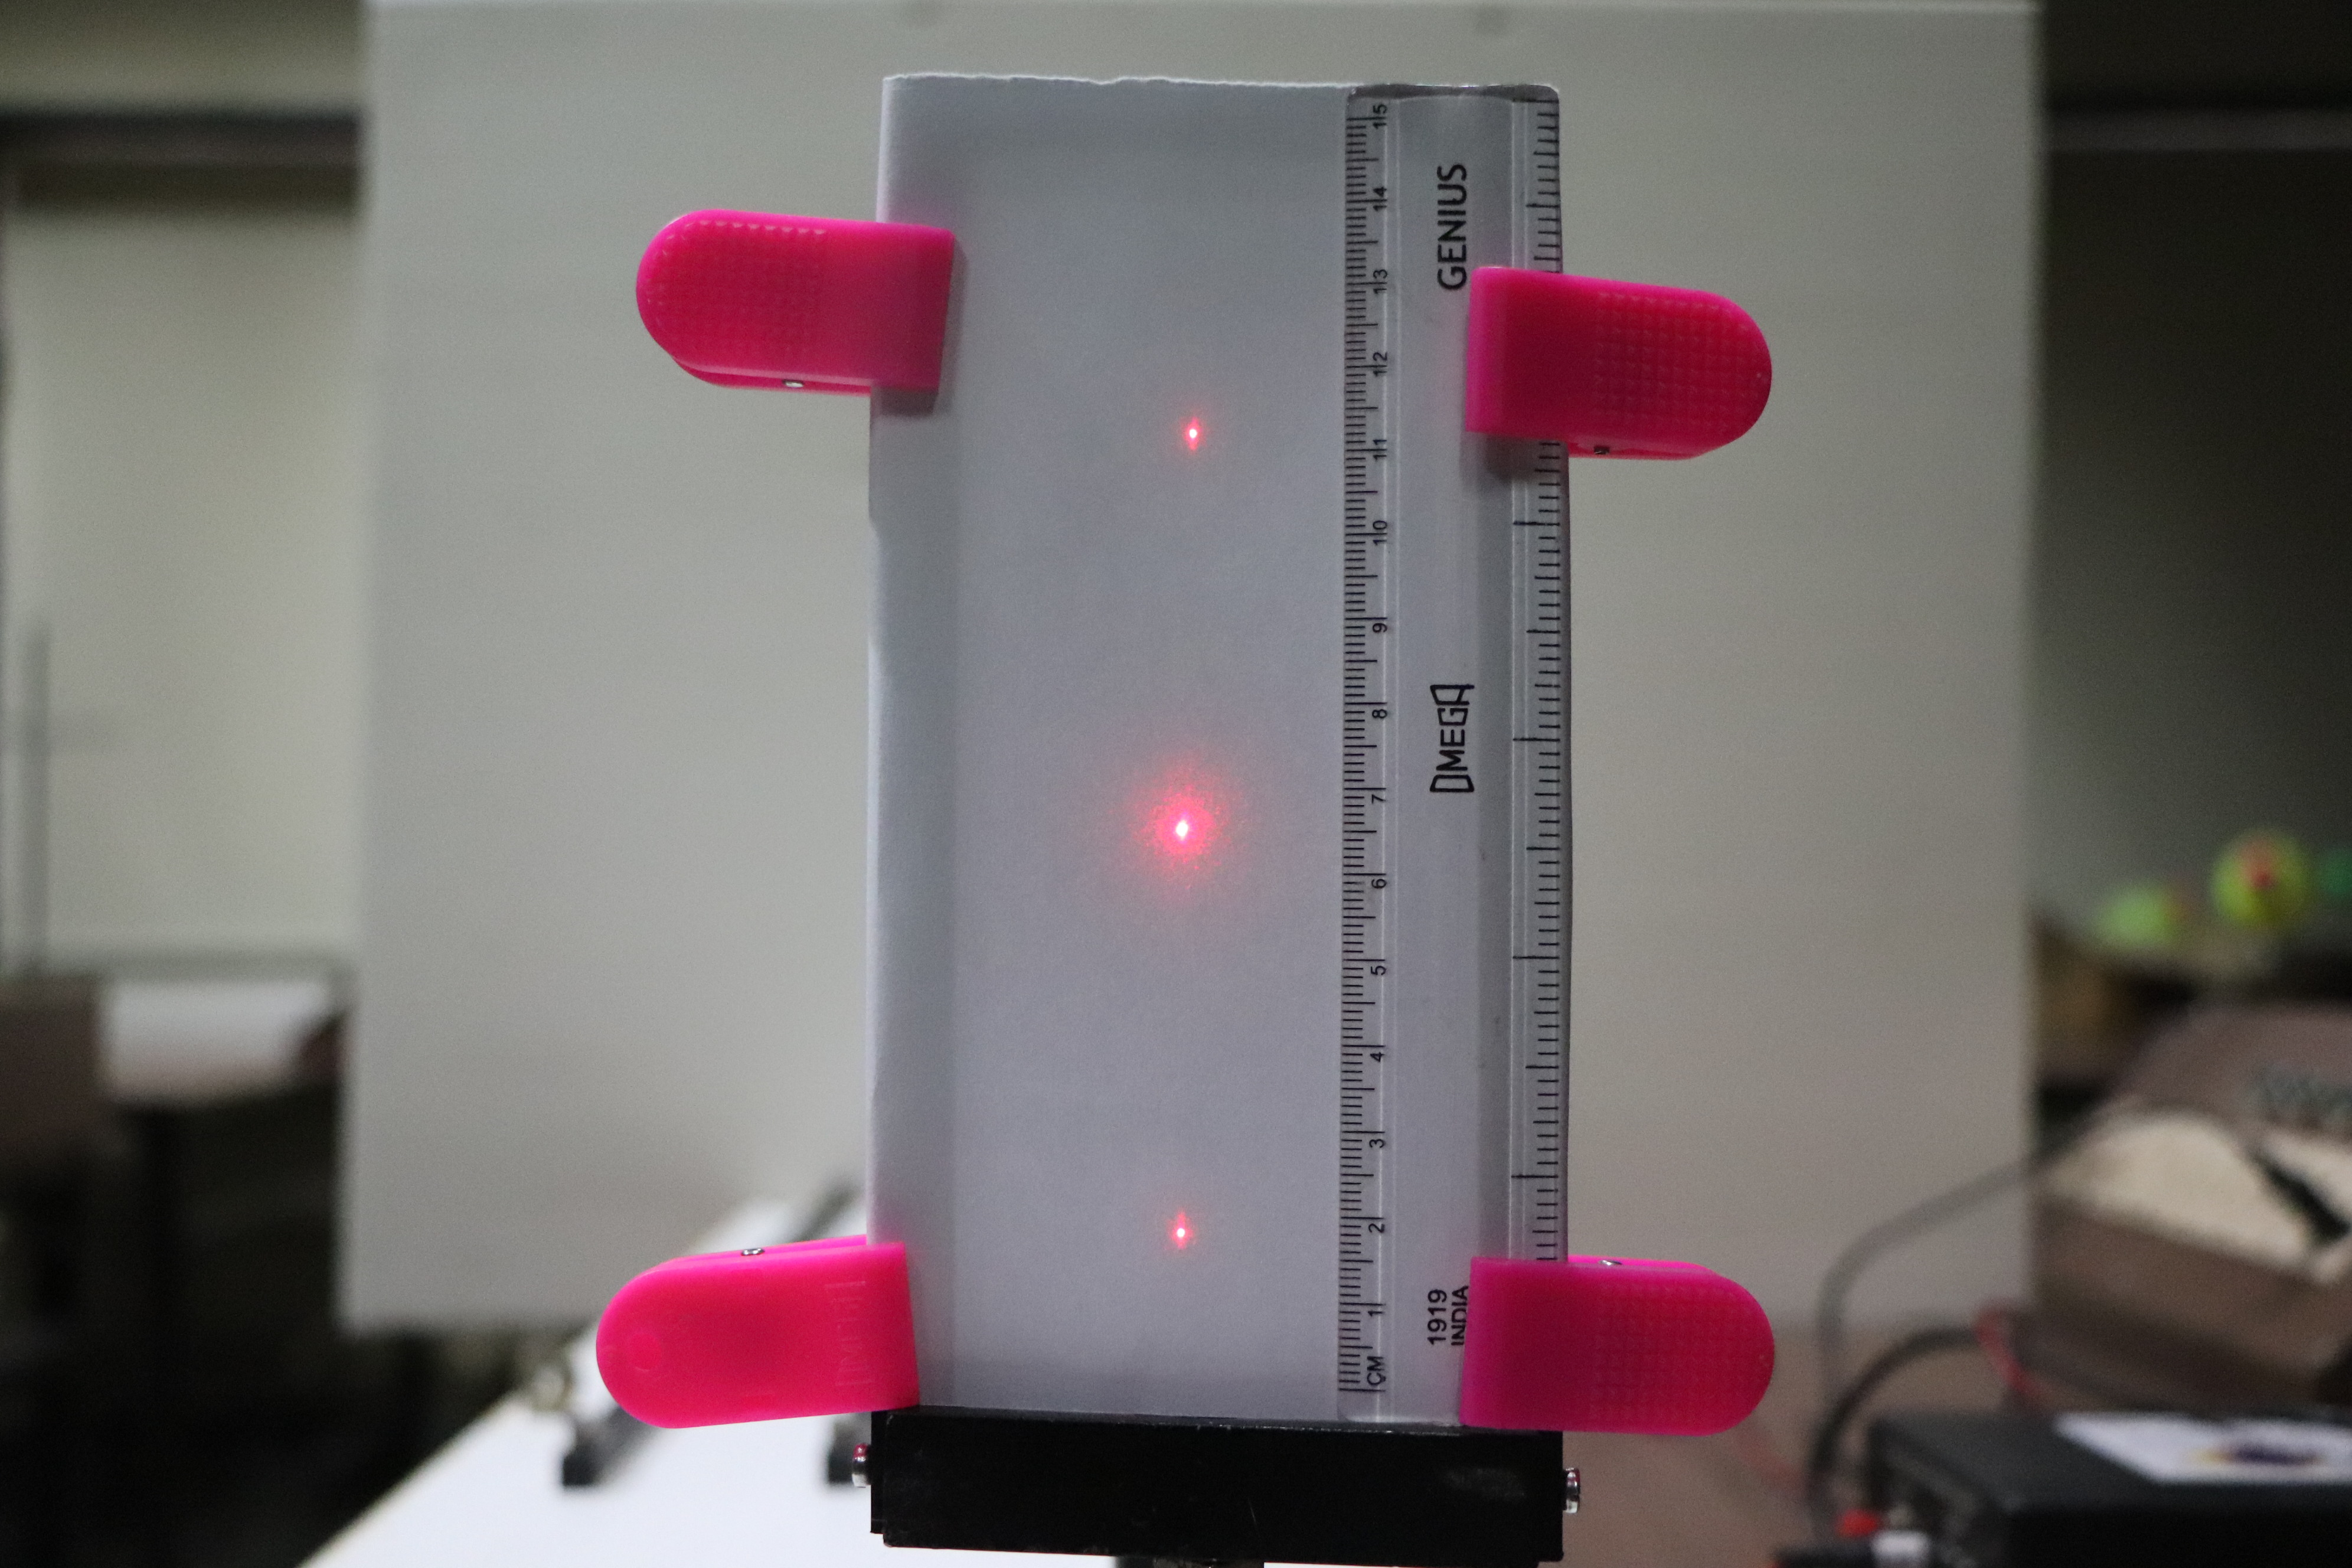
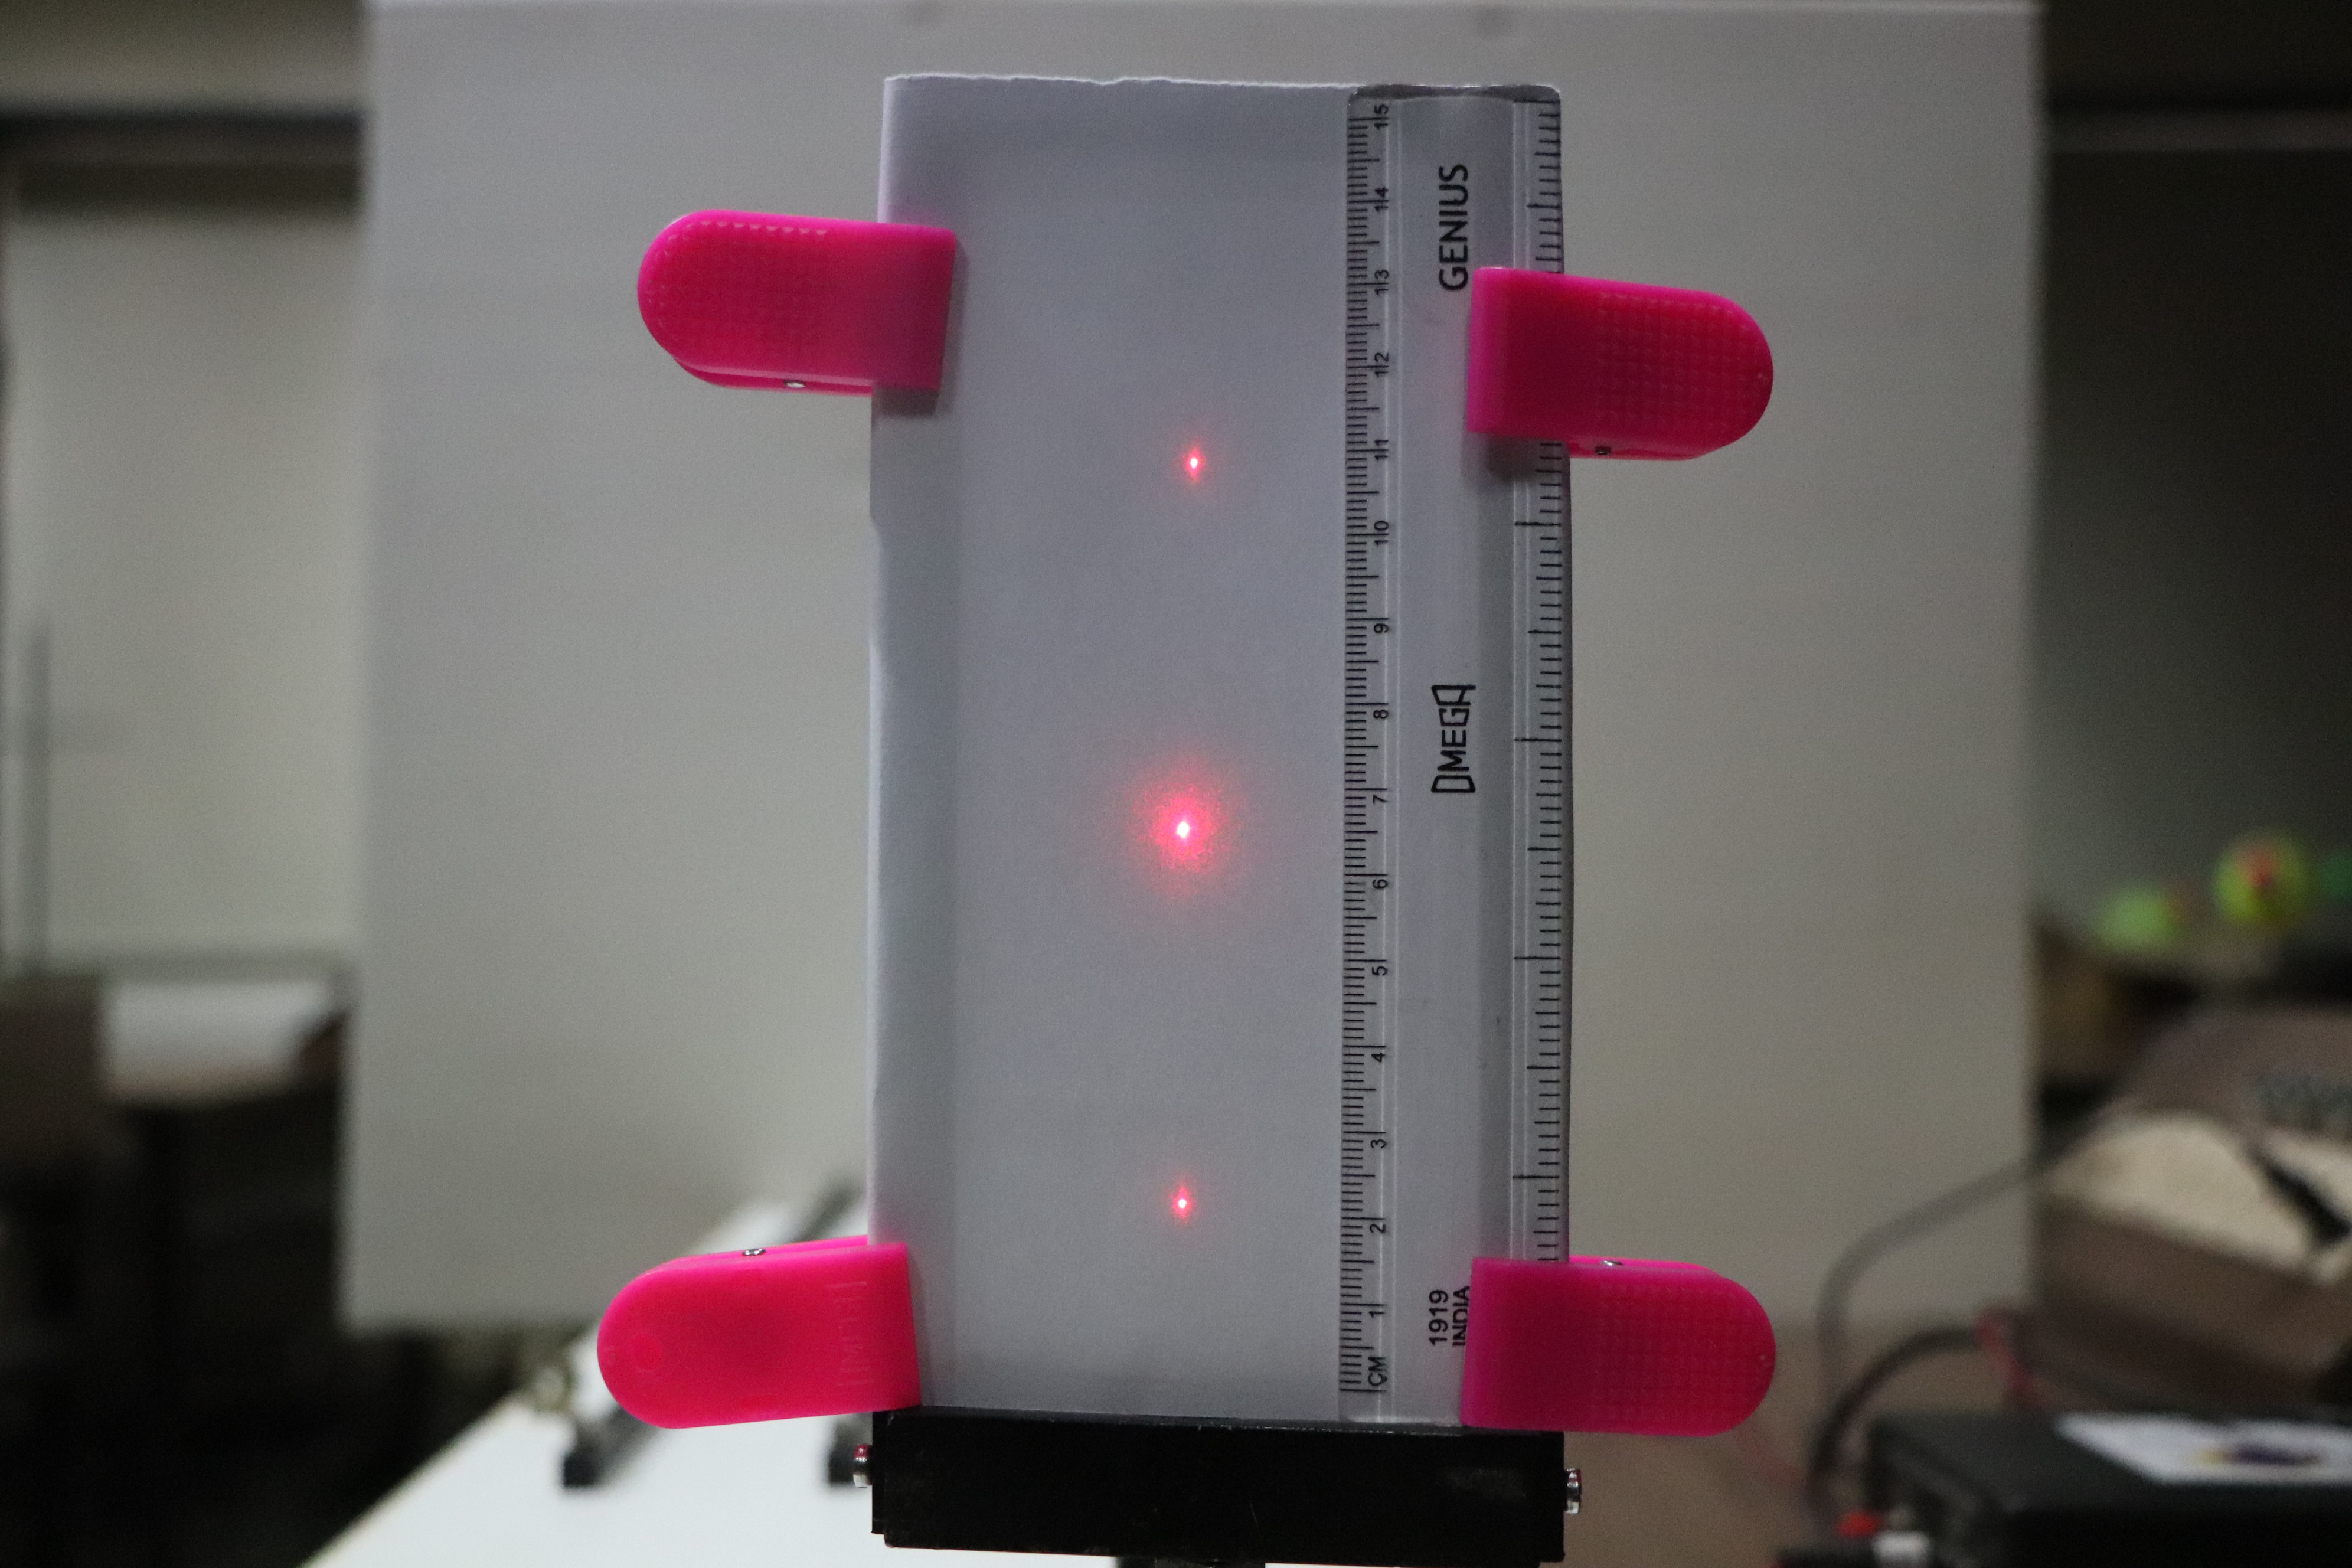
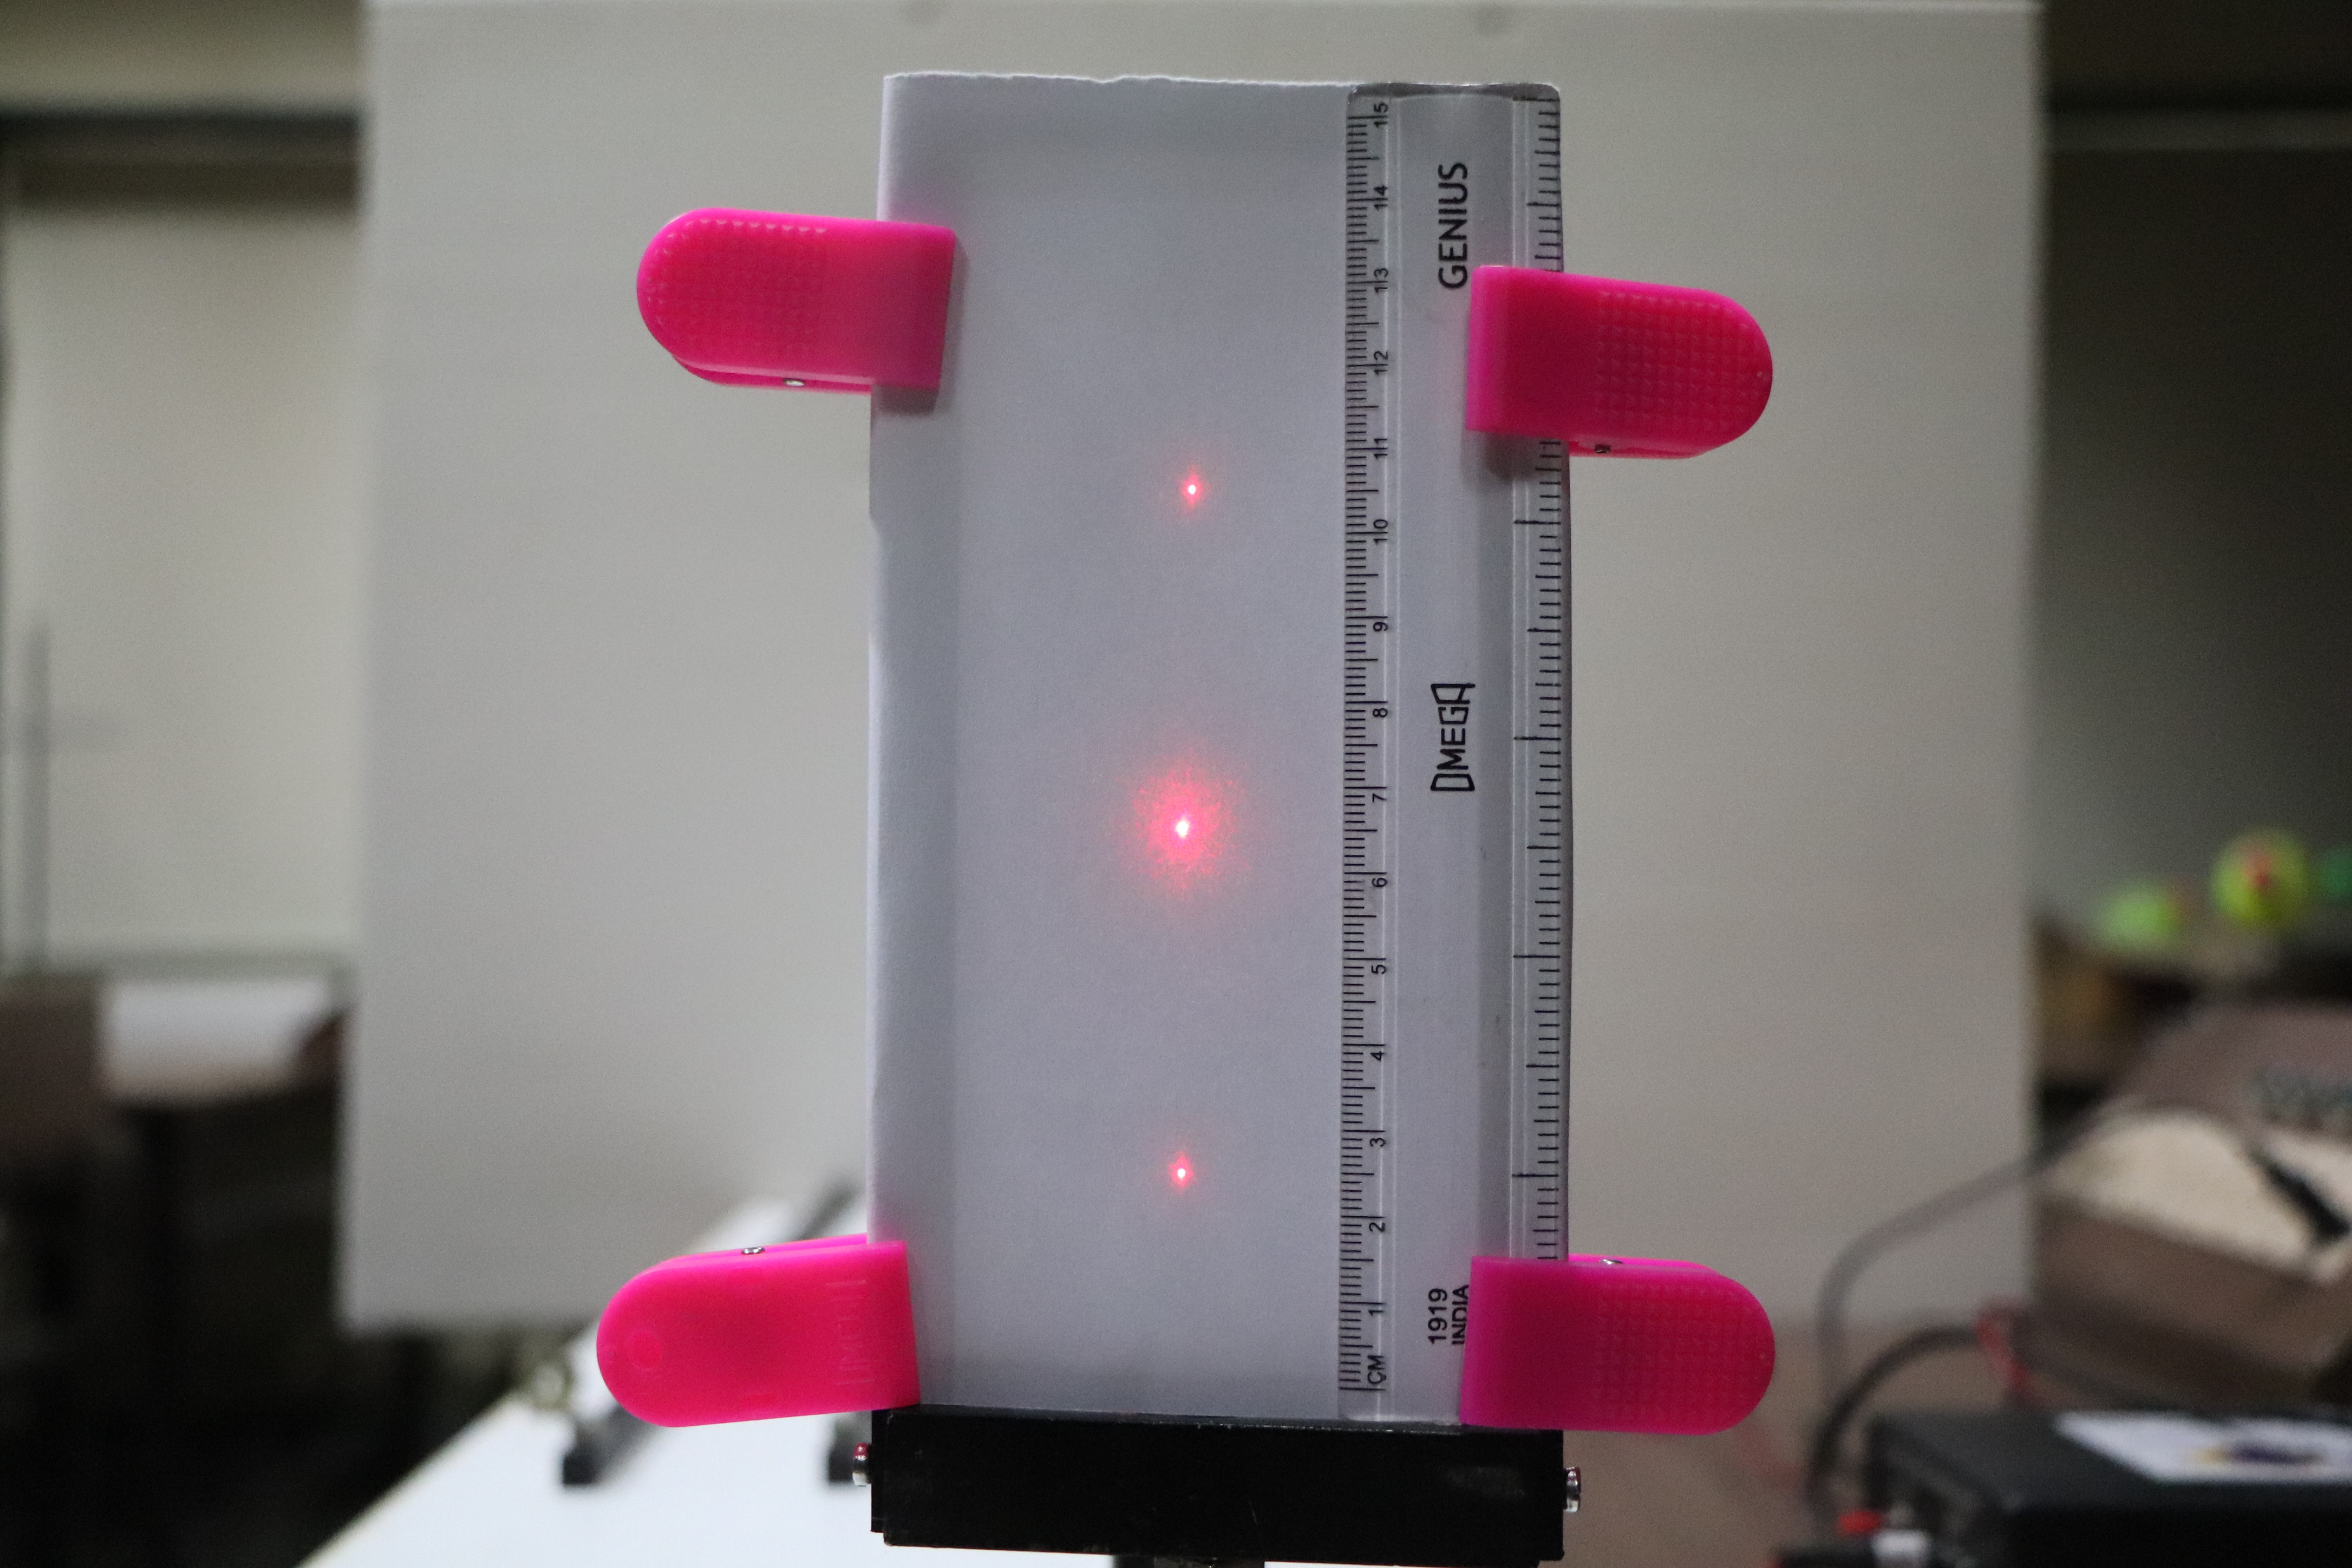
- The photographs of diffraction pattern for different distances between the screen and the grating are given below.
- The distance between the grating and the screen, D is mentioned on each photograph, which can be seen by magnifying the photograph.
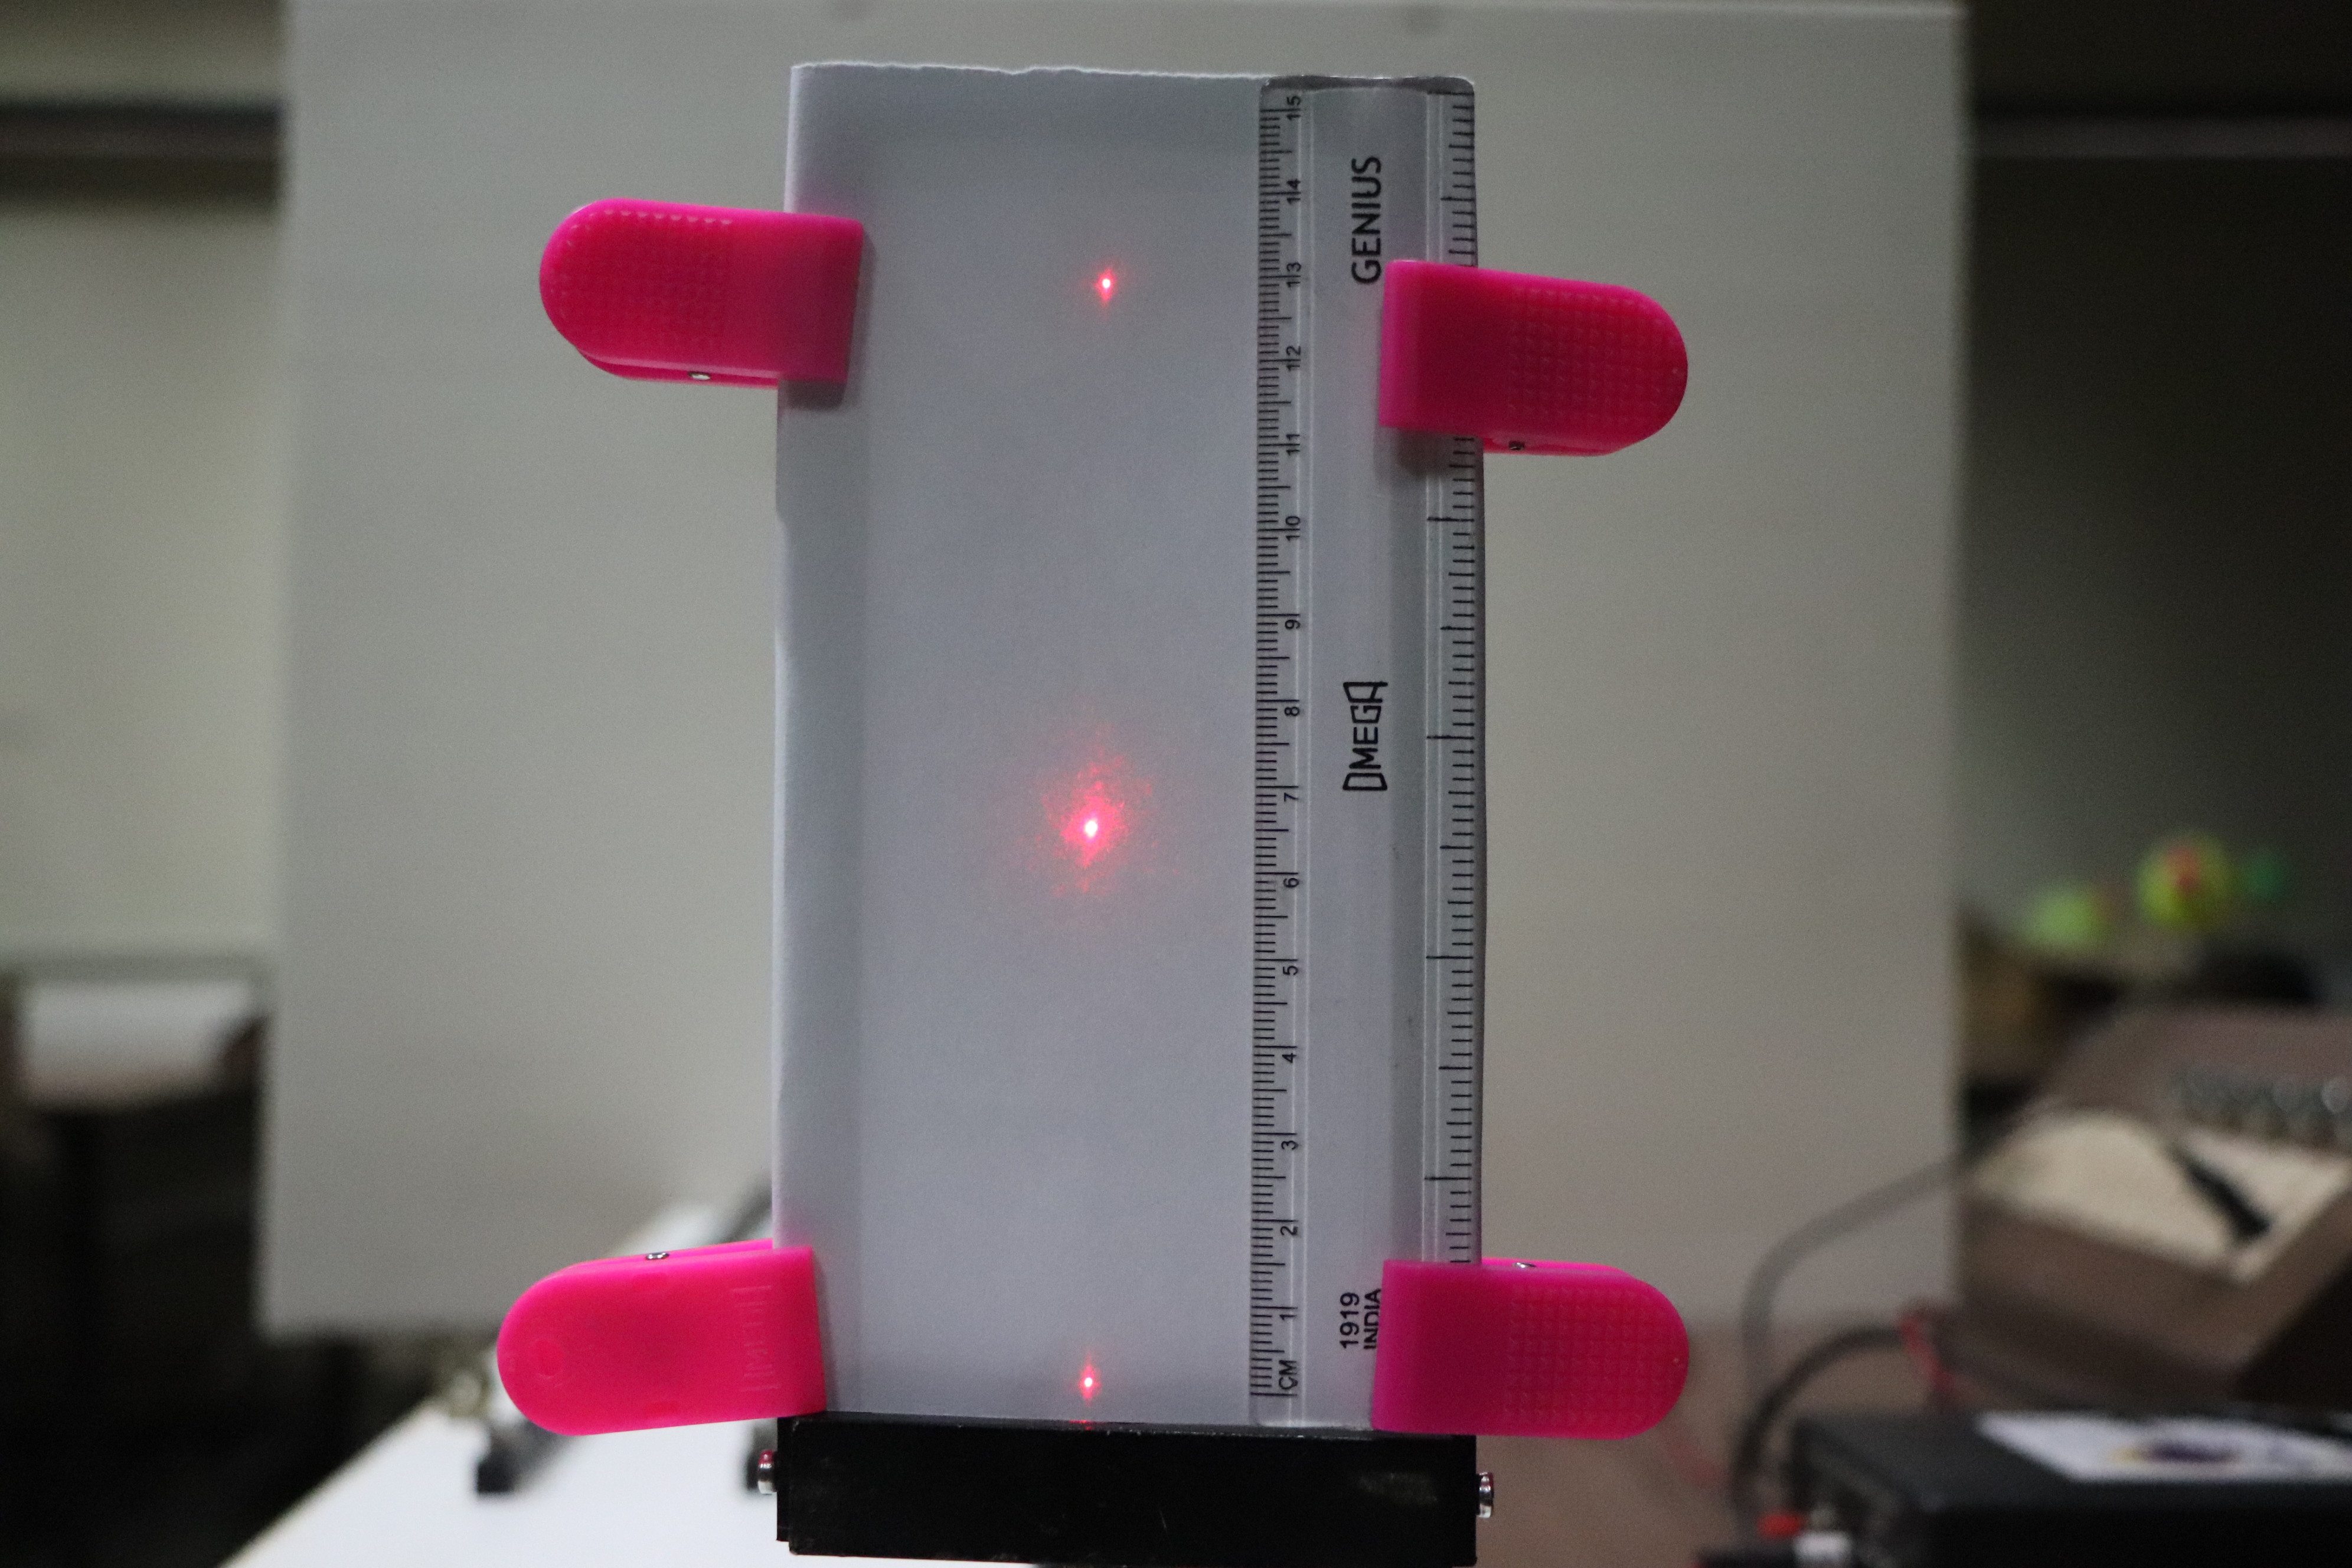
D= 17.0 cm 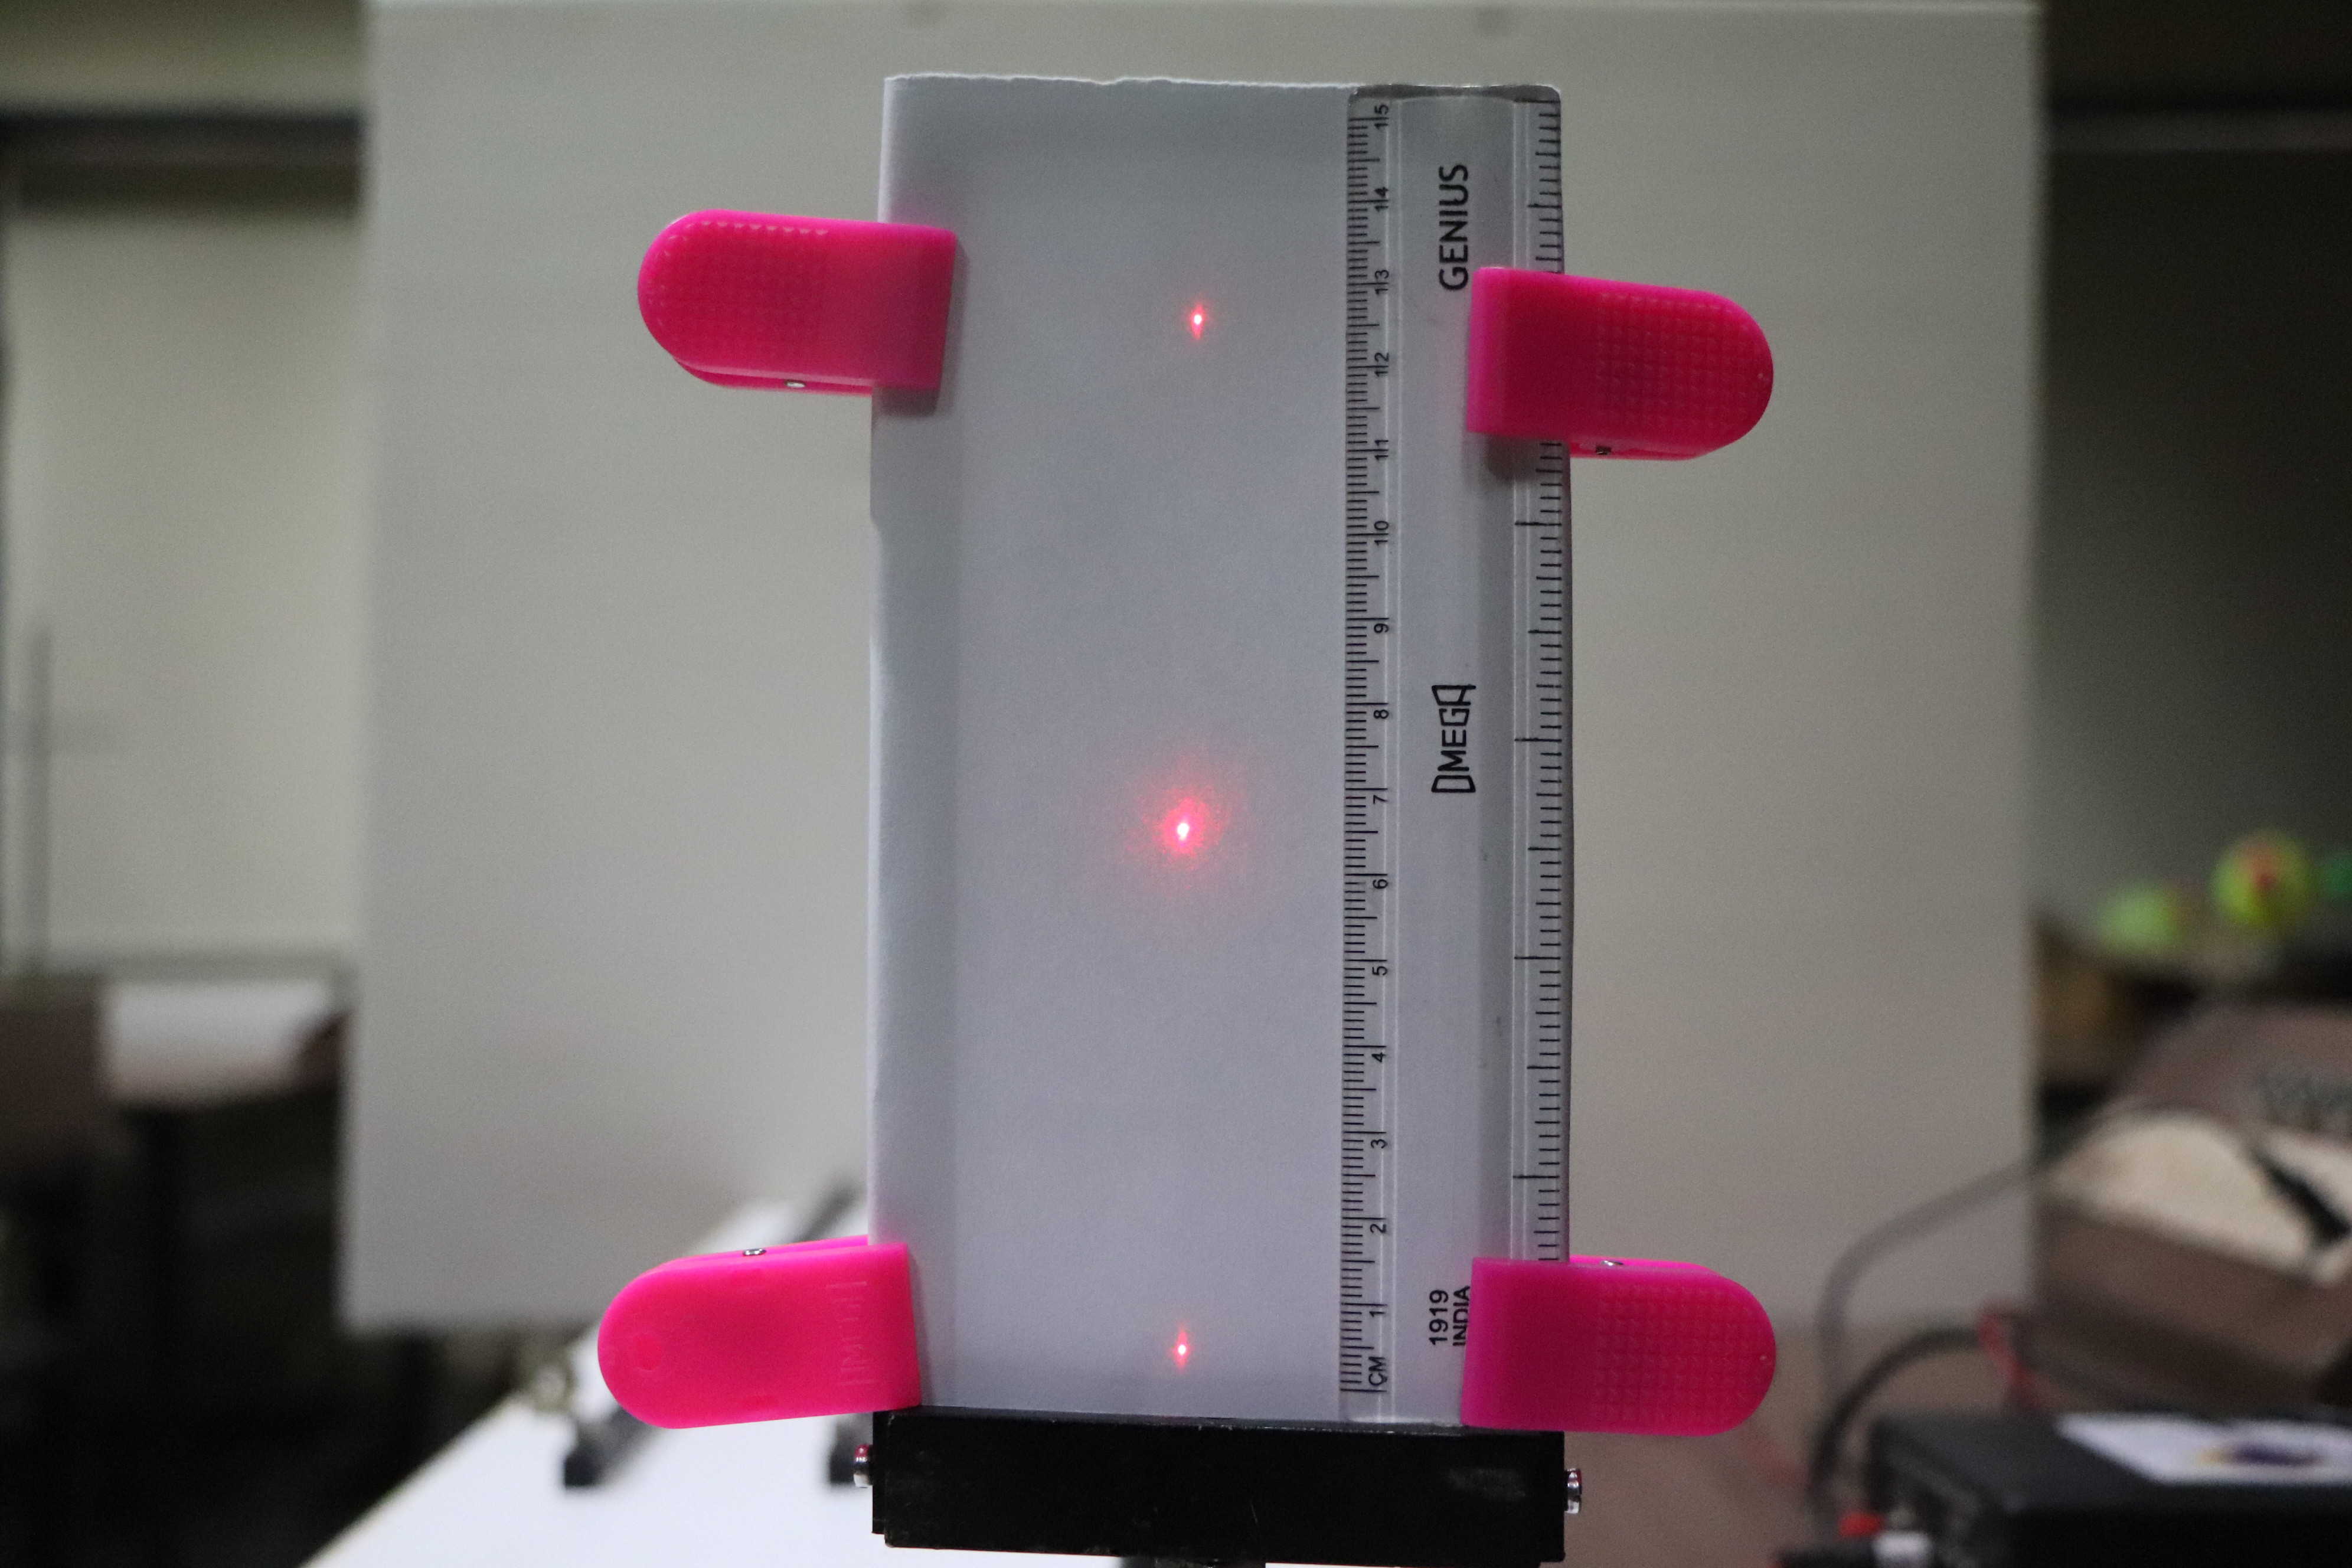
D= 16.0 cm 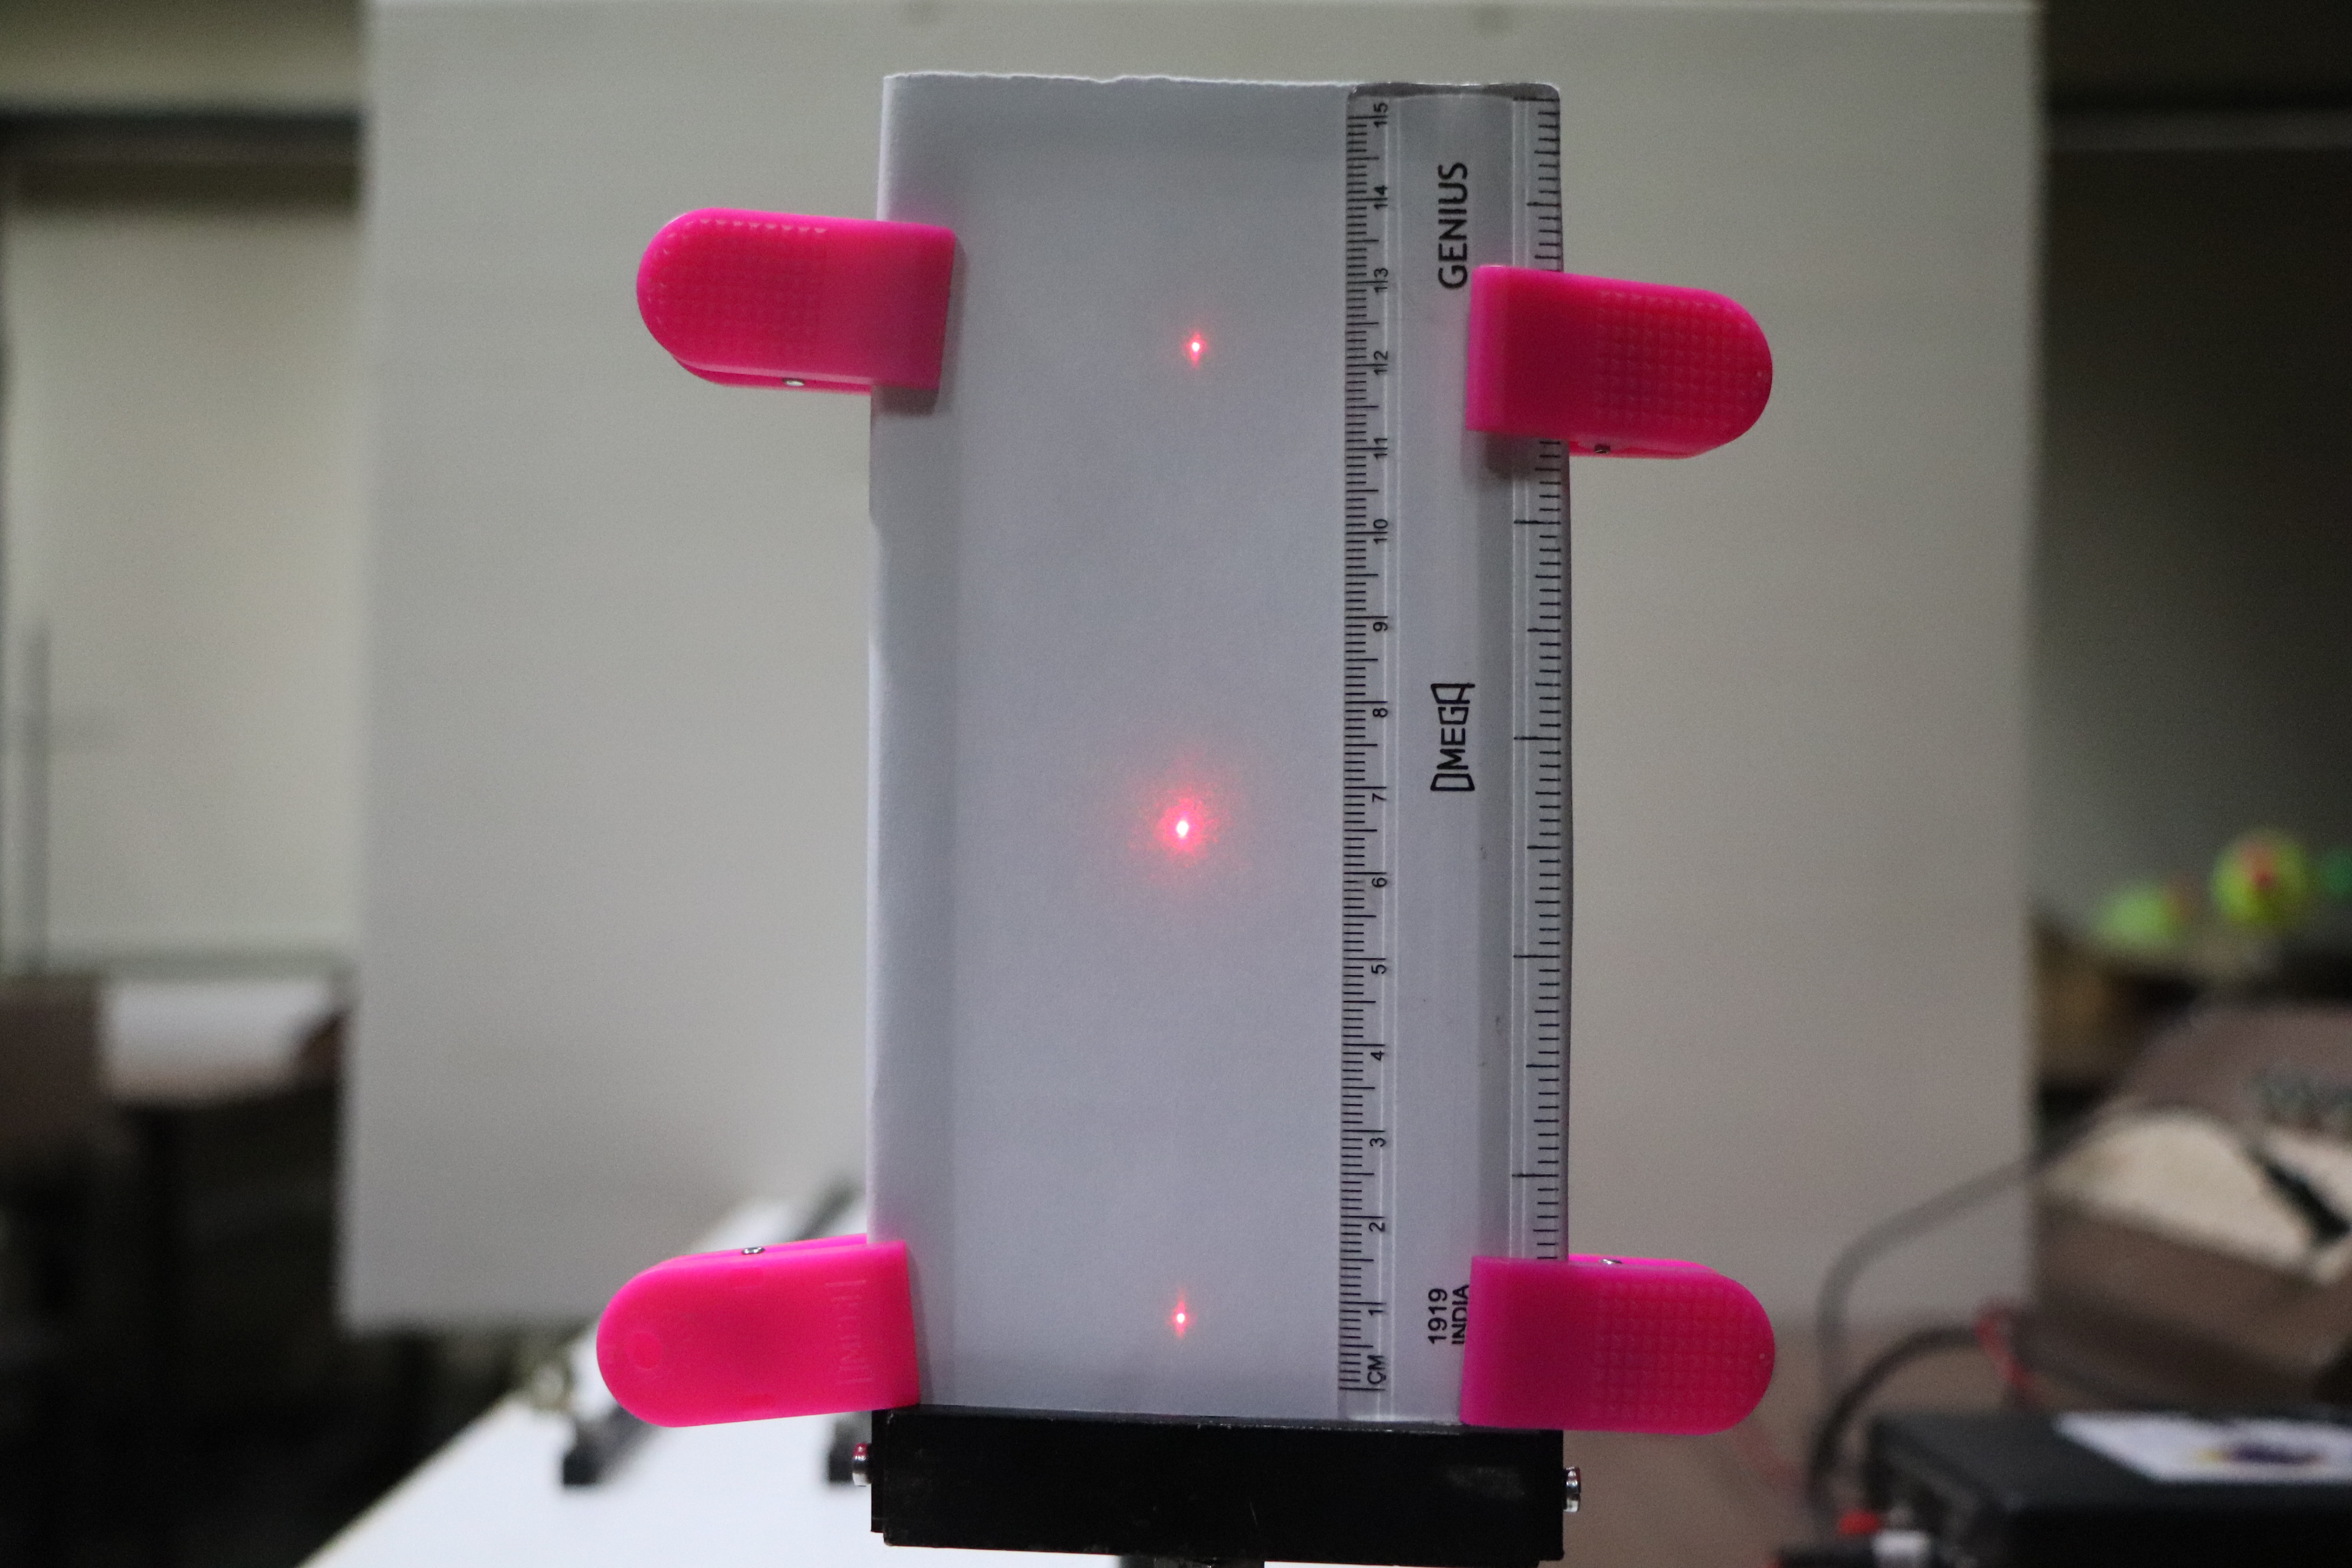
D= 15.0 cm 
D= 14.0 cm 
D= 13.0 cm 
D= 12.0 cm 
D= 11.0 cm 
D= 10.0 cm
- Generate the data with 1% uncertainty in the measurement, from the photographs above.
- Plot a suitable graph and determine the wavelength of laser only from the slope of the graph.
- The grating used in the experiment has 12868 lines/inches.
Click below to download high resolution images (if needed):
- Diffraction pattern for D = 17.0 cm
- Diffraction pattern for D = 16.0 cm
- Diffraction pattern for D = 15.0 cm
- Diffraction pattern for D = 14.0 cm
- Diffraction pattern for D = 13.0 cm
- Diffraction pattern for D = 12.0 cm
- Diffraction pattern for D = 11.0 cm
- Diffraction pattern for D = 10.0 cm
Observations:
In order to get your response, we are providing you with a google form. So that, we can get an idea about
- your data collection techniques,
- variables chosen for measurements,
- your data and
- the graphs that you will plot.
The google form: https://docs.google.com/forms/d/1LkTVewvaICMcGZBV__vBta59x6j2IIC5sFdiNBCzZCM/edi
Use the spreadsheet for calculations if needed: spreadsheet
You may download the graph sheet to plot the graph: Graph Sheet
Note:
What is meant by 1% uncertainty in the measurement of data?
When we say that we want to measure a variable, y with 1% uncertainty, it means that
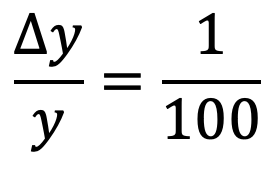
It means that the measured quantity is at least 100 times the least count.