Angular Speed of Ceiling Fan
Aim: To determine the angular speed of fan at different positions of the regulator knob.
Apparatus: Ceiling fan, stop watch
Introduction:
Have you ever wondered about the relation between the angular speed of a fan and the five step regulator knob. In this activity we will explore this relation. We have recorded the videos of a fan (in slow motion video mode of the smartphone) with regulator knob positions changing from 1 to 5. You are expected to generate the data from these videos and plot a graph between the angular speed of the fan and the knob position.
Procedure:
- From the videos given below, generate the data for angular speed of the fan at different regulator knob positions with 1% uncertainty in the measurement.
- Plot a graph between angular speed of the fan and the regulator knob position.
3. You can also download the videos by clicking on the links below:
a. Knob 1
b. Knob 2
c. Knob 3
d. Knob 4
e. Knob 5
Observations:
In order to get your response, we are providing you with a google form. So that, we can get an idea about
- your data collection techniques,
- variables chosen for measurements,
- your data and
- the graphs that you will plot.
The google form: https://docs.google.com/forms/d/154csQiQlT5Az5YcGHKtqeCnbMqUltpBUlErXrGXtBCo/edit
Use spreadsheet for calculations, if needed: spreadsheet
Download the graph sheet given below to plot the graph: Graph Sheet
Note:
What is meant by 1% uncertainty in the measurement of data?
When we say that we want to measure a variable, y with 1% uncertainty, it means that
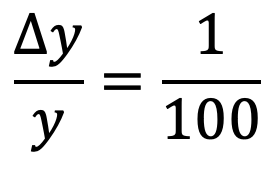
It means that the measured quantity is at least 100 times the least count.
Extra Work:
Repeat the same procedure for the ceiling fan at your home and plot the graph between the angular speed and knob position. Is there a change in the nature of the graph?